
Fiscal 2022 (unaudited) |
October 26, 2022 Fiscal 2023 Outlook (a) |
January 25, 2023 Fiscal 2023 Outlook (a) |
||||||||||||
| Total ADP | Revenues | $16,498M | 8 to 9% | 8 to 9% | ||||||||||
| Adj. EBIT Margin | 23.5% | 125 to 150 bps | 125 to 150 bps | |||||||||||
| Adj. Effective Tax Rate | 22.5% | ~23% | ~23% | |||||||||||
| Adj. Diluted EPS | $7.01 | 15 to 17% | 15 to 17% | |||||||||||
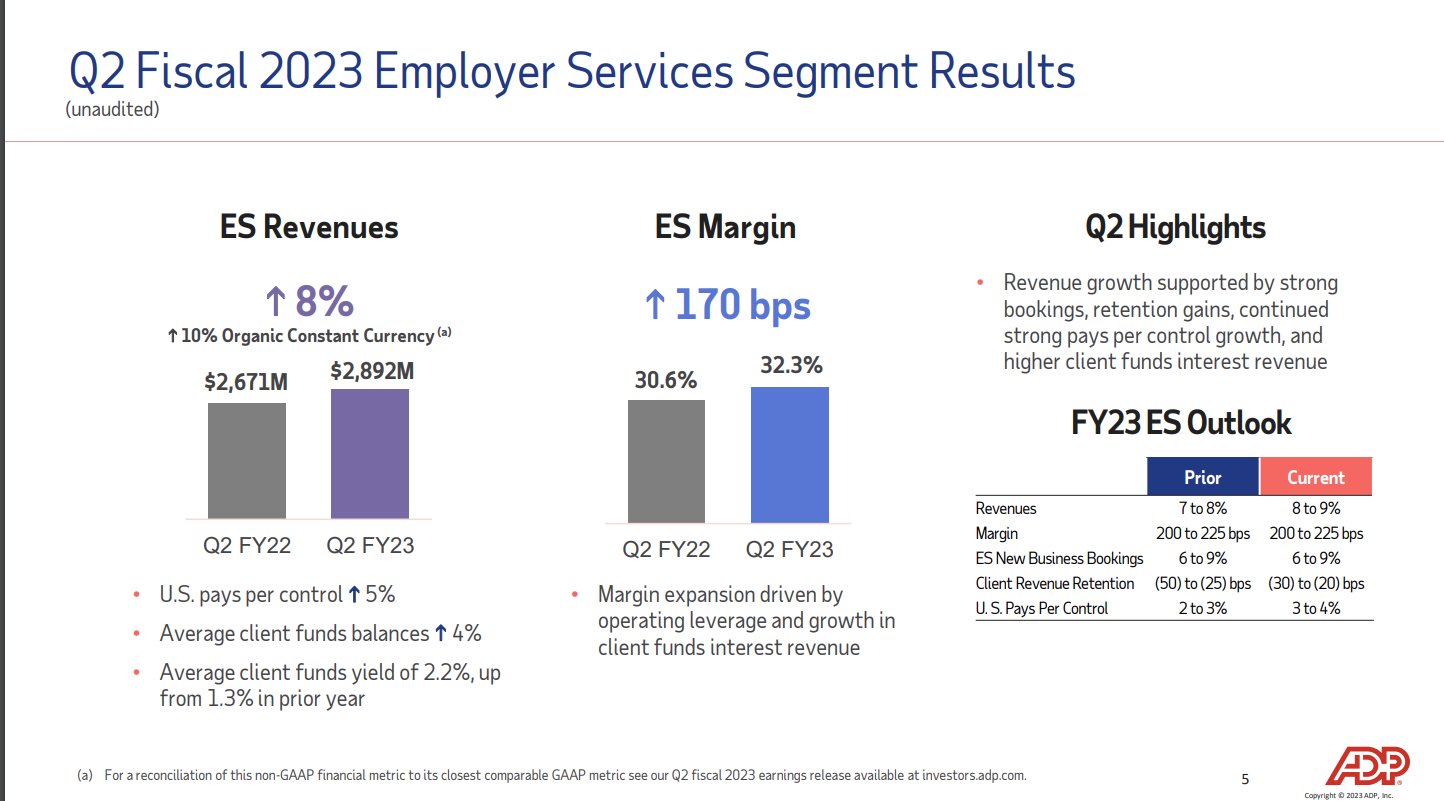
| Employer Services | Revenues | $10,968M | 7 to 8% | 8 to 9% | ||||||||||
| Margin | 31.1% | 200 to 225 bps | 200 to 225 bps | |||||||||||
| ES New Business Bookings | $1.7B | 6 to 9% | 6 to 9% | |||||||||||
| Client Revenue Retention | 92.1% | (50) to (25) bps | (30) to (20) bps | |||||||||||
| U.S. Pays Per Control | 7% | 2 to 3% | 3 to 4% | |||||||||||
| PEO Services | Revenues | $5,546M | 10 to 12% | 8 to 9% | ||||||||||
| Revenues Ex Zero-Margin Pass-throughs | $2,031M | 10 to 12% | 9 to 10% | |||||||||||
| Margin | 15.7% | Flat to up 25 bps | Flat to up 25 bps | |||||||||||
| Average WSEs | 670,000 | 8 to 10% | 6 to 7% | |||||||||||
| Client Funds Interest | Average Client Funds Balances | $32.5B | 4 to 6% | 4 to 5% | ||||||||||
| Yield on Client Funds Portfolio | 1.4% | ~2.4% | ~2.4% | |||||||||||
| Client Funds Interest Revenue | $452M | $790 to $810M | $790 to $800M | |||||||||||
| Net Impact from Client Funds Extended Strategy | $475M | $720 to $740M | $710 to $720M | |||||||||||
| Automatic Data Processing, Inc. and Subsidiaries | ||||||||||||||||||||||||||||||||||||||
| Statements of Consolidated Earnings | ||||||||||||||||||||||||||||||||||||||
| (In millions, except per share amounts) | ||||||||||||||||||||||||||||||||||||||
| (Unaudited) | ||||||||||||||||||||||||||||||||||||||
| Three Months Ended | Six Months Ended | |||||||||||||||||||||||||||||||||||||
| December 31, | December 31, | |||||||||||||||||||||||||||||||||||||
| 2022 | 2021 | 2022 | 2021 | |||||||||||||||||||||||||||||||||||
| Revenues: | ||||||||||||||||||||||||||||||||||||||
| Revenues, other than interest on funds held for clients and PEO revenues |
$ | 2,702.2 | $ | 2,561.8 | $ | 5,348.6 | $ | 5,029.6 | ||||||||||||||||||||||||||||||
| Interest on funds held for clients | 187.2 | 106.0 | 328.3 | 207.1 | ||||||||||||||||||||||||||||||||||
| PEO revenues (A) (B) (C) | 1,501.6 | 1,357.6 | 2,929.7 | 2,621.0 | ||||||||||||||||||||||||||||||||||
| Total revenues | 4,391.0 | 4,025.4 | 8,606.6 | 7,857.7 | ||||||||||||||||||||||||||||||||||
| Expenses: | ||||||||||||||||||||||||||||||||||||||
| Costs of revenues: | ||||||||||||||||||||||||||||||||||||||
| Operating expenses (B) (C) | 2,134.5 | 2,040.7 | 4,209.0 | 3,971.5 | ||||||||||||||||||||||||||||||||||
| Systems development and programming costs | 204.2 | 199.7 | 413.9 | 388.5 | ||||||||||||||||||||||||||||||||||
| Depreciation and amortization | 112.0 | 100.8 | 221.4 | 203.8 | ||||||||||||||||||||||||||||||||||
| Total costs of revenues | 2,450.7 | 2,341.2 | 4,844.3 | 4,563.8 | ||||||||||||||||||||||||||||||||||
| Selling, general, and administrative expenses | 855.7 | 782.3 | 1,656.1 | 1,501.5 | ||||||||||||||||||||||||||||||||||
| Interest expense | 57.0 | 18.4 | 108.1 | 36.9 | ||||||||||||||||||||||||||||||||||
| Total expenses | 3,363.4 | 3,141.9 | 6,608.5 | 6,102.2 | ||||||||||||||||||||||||||||||||||
| Other (income)/expense, net | (30.5) | (26.6) | (70.0) | (55.4) | ||||||||||||||||||||||||||||||||||
| Earnings before income taxes | 1,058.1 | 910.1 | 2,068.1 | 1,810.9 | ||||||||||||||||||||||||||||||||||
| Provision for income taxes | 245.0 | 215.7 | 475.9 | 416.0 | ||||||||||||||||||||||||||||||||||
| Net earnings | $ | 813.1 | $ | 694.4 | $ | 1,592.2 | $ | 1,394.9 | ||||||||||||||||||||||||||||||
| Basic earnings per share | $ | 1.96 | $ | 1.65 | $ | 3.84 | $ | 3.32 | ||||||||||||||||||||||||||||||
| Diluted earnings per share | $ | 1.95 | $ | 1.65 | $ | 3.82 | $ | 3.30 | ||||||||||||||||||||||||||||||
| Components of Other (income)/expense, net: | ||||||||||||||||||||||||||||||||||||||
| Interest income on corporate funds | $ | (28.9) | $ | (8.5) | $ | (58.6) | $ | (18.2) | ||||||||||||||||||||||||||||||
| Realized losses/(gains) on available-for-sale securities, net | 11.5 | (0.4) | 13.0 | (0.5) | ||||||||||||||||||||||||||||||||||
| Gain on sale of assets | — | — | — | (1.3) | ||||||||||||||||||||||||||||||||||
| Impairment of assets | — | — | 0.3 | — | ||||||||||||||||||||||||||||||||||
| Non-service components of pension income, net | (13.1) | (17.7) | (24.7) | (35.4) | ||||||||||||||||||||||||||||||||||
| Other (income)/expense, net | $ | (30.5) | $ | (26.6) | $ | (70.0) | $ | (55.4) | ||||||||||||||||||||||||||||||
| Automatic Data Processing, Inc. and Subsidiaries | |||||||||||
| Consolidated Balance Sheets | |||||||||||
| (In millions, except per share amounts) | |||||||||||
| (Unaudited) | |||||||||||
| December 31, | June 30, | ||||||||||
| 2022 | 2022 | ||||||||||
| Assets | |||||||||||
| Current assets: | |||||||||||
| Cash and cash equivalents | $ | 1,345.0 | $ | 1,436.3 | |||||||
Accounts receivable, net of allowance for doubtful accounts of $50.0 and $56.8, respectively |
3,162.3 | 3,170.6 | |||||||||
| Other current assets | 875.8 | 628.8 | |||||||||
| Total current assets before funds held for clients | 5,383.1 | 5,235.7 | |||||||||
| Funds held for clients | 40,760.5 | 49,569.2 | |||||||||
| Total current assets | 46,143.6 | 54,804.9 | |||||||||
| Long-term receivables, net of allowance for doubtful accounts of $0.2 and $0.1, respectively | 7.7 | 9.1 | |||||||||
| Property, plant and equipment, net | 655.1 | 652.6 | |||||||||
| Operating lease right-of-use asset | 400.3 | 450.9 | |||||||||
| Deferred contract costs | 2,574.8 | 2,579.7 | |||||||||
| Other assets | 990.9 | 937.4 | |||||||||
| Goodwill | 2,315.0 | 2,300.5 | |||||||||
| Intangible assets, net | 1,365.6 | 1,333.1 | |||||||||
| Total assets | $ | 54,453.0 | $ | 63,068.2 | |||||||
| Liabilities and Stockholders' Equity | |||||||||||
| Current liabilities: | |||||||||||
| Accounts payable | $ | 85.3 | $ | 110.2 | |||||||
| Accrued expenses and other current liabilities | 2,373.3 | 2,107.8 | |||||||||
| Accrued payroll and payroll-related expenses | 590.8 | 862.6 | |||||||||
| Dividends payable | 514.6 | 429.6 | |||||||||
| Short-term deferred revenues | 176.8 | 188.2 | |||||||||
| Obligations under reverse repurchase agreements (A) | — | 136.4 | |||||||||
| Income taxes payable | 11.1 | 38.4 | |||||||||
| Total current liabilities before client funds obligations | 3,751.9 | 3,873.2 | |||||||||
| Client funds obligations | 43,061.8 | 51,285.5 | |||||||||
| Total current liabilities | 46,813.7 | 55,158.7 | |||||||||
| Long-term debt | 2,988.1 | 2,987.1 | |||||||||
| Operating lease liabilities | 334.1 | 370.9 | |||||||||
| Other liabilities | 931.6 | 924.2 | |||||||||
| Deferred income taxes | 66.8 | 67.0 | |||||||||
| Long-term deferred revenues | 332.0 | 335.0 | |||||||||
| Total liabilities | 51,466.3 | 59,842.9 | |||||||||
| Stockholders' equity: | |||||||||||
| Preferred stock, $1.00 par value: authorized, 0.3 shares; issued, none | — | — | |||||||||
Common stock, $0.10 par value: authorized, 1,000.0 shares; issued, 638.7 shares at December 31, 2022 and June 30, 2022; outstanding, 414.4 and 416.1 shares at December 31, 2022 and June 30, 2022, respectively |
63.9 | 63.9 | |||||||||
| Capital in excess of par value | 1,954.2 | 1,794.2 | |||||||||
| Retained earnings | 21,333.0 | 20,696.3 | |||||||||
| Treasury stock - at cost: 224.4 and 222.7 shares at December 31, 2022 and June 30, 2022, respectively | (17,913.5) | (17,335.4) | |||||||||
| Accumulated other comprehensive (loss)/ income | (2,450.9) | (1,993.7) | |||||||||
| Total stockholders’ equity | 2,986.7 | 3,225.3 | |||||||||
| Total liabilities and stockholders’ equity | $ | 54,453.0 | $ | 63,068.2 | |||||||
| Automatic Data Processing, Inc. and Subsidiaries | |||||||||||
| Statements of Consolidated Cash Flows | |||||||||||
| (In millions) | |||||||||||
| (Unaudited) | Six Months Ended | ||||||||||
| December 31, | |||||||||||
| 2022 | 2021 | ||||||||||
| Cash Flows from Operating Activities: | |||||||||||
| Net earnings | $ | 1,592.2 | $ | 1,394.9 | |||||||
| Adjustments to reconcile net earnings to cash flows provided by operating activities: | |||||||||||
| Depreciation and amortization | 271.9 | 255.6 | |||||||||
| Amortization of deferred contract costs | 488.6 | 474.9 | |||||||||
| Deferred income taxes | 9.9 | 46.4 | |||||||||
| Stock-based compensation expense | 109.0 | 97.9 | |||||||||
| Net pension income | (20.0) | (31.6) | |||||||||
| Net amortization of premiums and accretion of discounts on available-for-sale securities | 23.6 | 48.5 | |||||||||
| Other | 30.8 | 6.8 | |||||||||
| Changes in operating assets and liabilities: | |||||||||||
| Increase in accounts receivable | (1.1) | (26.0) | |||||||||
| Increase in other assets | (787.9) | (668.6) | |||||||||
| Decrease in accounts payable | (20.5) | (19.9) | |||||||||
| Decrease in accrued expenses and other liabilities | (78.7) | (363.3) | |||||||||
| Net cash flows provided by operating activities | 1,617.8 | 1,215.6 | |||||||||
| Cash Flows from Investing Activities: | |||||||||||
| Purchases of corporate and client funds marketable securities | (3,707.1) | (5,223.3) | |||||||||
| Proceeds from the sales and maturities of corporate and client funds marketable securities | 2,525.6 | 1,996.9 | |||||||||
| Capital expenditures | (95.1) | (75.8) | |||||||||
| Additions to intangibles | (178.4) | (180.7) | |||||||||
| Acquisitions of businesses, net of cash acquired | (14.4) | (11.7) | |||||||||
| Proceeds from sale of property, plant, and equipment and other assets | — | 26.2 | |||||||||
| Net cash flows used in investing activities | (1,469.4) | (3,468.4) | |||||||||
| Cash Flows from Financing Activities: | |||||||||||
| Net (decrease)/increase in client funds obligations | (8,096.8) | 11,415.8 | |||||||||
| Payments of debt | (0.5) | (0.5) | |||||||||
| Repurchases of common stock | (553.5) | (990.5) | |||||||||
| Net proceeds from stock purchase plan and stock-based compensation plans | 24.8 | 50.4 | |||||||||
| Dividends paid | (865.5) | (787.0) | |||||||||
| Net payments related to reverse repurchase agreements | (132.8) | (23.5) | |||||||||
| Net cash flows (used in)/provided by financing activities | (9,624.3) | 9,664.7 | |||||||||
| Effect of exchange rate changes on cash, cash equivalents, restricted cash, and restricted cash equivalents | (24.6) | (20.9) | |||||||||
| Net change in cash, cash equivalents, restricted cash, and restricted cash equivalents | (9,500.5) | 7,391.0 | |||||||||
| Cash, cash equivalents, restricted cash, and restricted cash equivalents, beginning of period | 22,783.0 | 13,143.2 | |||||||||
| Cash, cash equivalents, restricted cash, and restricted cash equivalents, end of period | $ | 13,282.5 | $ | 20,534.2 | |||||||
| Reconciliation of cash, cash equivalents, restricted cash, and restricted cash equivalents to the Consolidated Balance Sheets | |||||||||||
| Cash and cash equivalents | 1,345.0 | 1,745.0 | |||||||||
| Restricted cash and restricted cash equivalents included in funds held for clients | 11,937.5 | 18,789.2 | |||||||||
| Total cash, cash equivalents, restricted cash, and restricted cash equivalents | $ | 13,282.5 | $ | 20,534.2 | |||||||
| Supplemental disclosures of cash flow information: | |||||||||||
| Cash paid for interest | $ | 104.5 | $ | 33.1 | |||||||
| Cash paid for income taxes, net of income tax refunds | $ | 537.1 | $ | 365.7 | |||||||
| Automatic Data Processing, Inc. and Subsidiaries | ||||||||||||||||||||||||||||||||||||||
| Other Selected Financial Data | ||||||||||||||||||||||||||||||||||||||
| (Dollars in millions, except per share amounts) | ||||||||||||||||||||||||||||||||||||||
| (Unaudited) | ||||||||||||||||||||||||||||||||||||||
| Three Months Ended | Six Months Ended | |||||||||||||||||||||||||||||||||||||
| December 31, | December 31, | |||||||||||||||||||||||||||||||||||||
| 2022 | 2021 | % Change | 2022 | 2021 | % Change | |||||||||||||||||||||||||||||||||
| Segment revenues | ||||||||||||||||||||||||||||||||||||||
Employer Services |
$ | 2,891.9 | $ | 2,671.3 | 8 | % | $ | 5,682.2 | $ | 5,242.8 | 8 | % | ||||||||||||||||||||||||||
PEO Services |
1,503.3 | 1,358.8 | 11 | % | 2,932.7 | 2,622.9 | 12 | % | ||||||||||||||||||||||||||||||
Other |
(4.2) | (4.7) | n/m | (8.3) | (8.0) | n/m | ||||||||||||||||||||||||||||||||
Total revenues |
$ | 4,391.0 | $ | 4,025.4 | 9 | % | $ | 8,606.6 | $ | 7,857.7 | 10 | % | ||||||||||||||||||||||||||
| Segment earnings | ||||||||||||||||||||||||||||||||||||||
Employer Services |
$ | 934.6 | $ | 817.3 | 14 | % | $ | 1,798.1 | $ | 1,601.3 | 12 | % | ||||||||||||||||||||||||||
PEO Services |
255.6 | 212.7 | 20 | % | 485.9 | 405.7 | 20 | % | ||||||||||||||||||||||||||||||
Other |
(132.1) | (119.9) | n/m | (215.9) | (196.1) | n/m | ||||||||||||||||||||||||||||||||
Total pretax earnings |
$ | 1,058.1 | $ | 910.1 | 16 | % | $ | 2,068.1 | $ | 1,810.9 | 14 | % | ||||||||||||||||||||||||||
| Segment margin | ||||||||||||||||||||||||||||||||||||||
Employer Services |
32.3 | % | 30.6 | % | 1.7 | % | 31.6 | % | 30.5 | % | 1.1 | % | ||||||||||||||||||||||||||
PEO Services |
17.0 | % | 15.7 | % | 1.3 | % | 16.6 | % | 15.5 | % | 1.1 | % | ||||||||||||||||||||||||||
Other |
n/m | n/m | n/m | n/m | n/m | n/m | ||||||||||||||||||||||||||||||||
Total pretax margin |
24.1 | % | 22.6 | % | 1.5 | % | 24.0 | % | 23.0 | % | 1.0 | % | ||||||||||||||||||||||||||
| Three Months Ended | Six Months Ended | |||||||||||||||||||||||||||||||||||||
| December 31, | December 31, | |||||||||||||||||||||||||||||||||||||
| Earnings per share information | 2022 | 2021 | % Change | 2022 | 2021 | % Change | ||||||||||||||||||||||||||||||||
| Net earnings | $ | 813.1 | $ | 694.4 | 17 | % | $ | 1,592.2 | $ | 1,394.9 | 14 | % | ||||||||||||||||||||||||||
| Basic weighted average shares outstanding | 414.3 | 419.8 | (1) | % | 414.4 | 420.6 | (1) | % | ||||||||||||||||||||||||||||||
| Basic earnings per share | $ | 1.96 | $ | 1.65 | 19 | % | $ | 3.84 | $ | 3.32 | 16 | % | ||||||||||||||||||||||||||
| Diluted weighted average shares outstanding | 416.2 | 422.0 | (1) | % | 416.6 | 422.9 | (1) | % | ||||||||||||||||||||||||||||||
| Diluted earnings per share | $ | 1.95 | $ | 1.65 | 18 | % | $ | 3.82 | $ | 3.30 | 16 | % | ||||||||||||||||||||||||||
| Three Months Ended | Six Months Ended | ||||||||||||||||||||||
| December 31, | December 31, | ||||||||||||||||||||||
| 2022 | 2021 | 2022 | 2021 | ||||||||||||||||||||
| Key Statistics: | |||||||||||||||||||||||
| Employer Services: | |||||||||||||||||||||||
Change in pays per control - U.S. (A) |
5 | % | 6 | % | 6 | % | 7 | % | |||||||||||||||
| PEO Services: | |||||||||||||||||||||||
| Paid PEO worksite employees at end of period | 710,000 | 668,000 | 710,000 | 668,000 | |||||||||||||||||||
| Average paid PEO worksite employees during the period | 711,000 | 660,000 | 708,000 | 644,000 | |||||||||||||||||||
Significant PEO expenses included within Operating expenses |
|||||||||||||||||||||||
Zero-margin benefits pass-through costs |
$ | 944.2 | $ | 863.9 | $ | 1,890.0 | $ | 1,703.4 | |||||||||||||||
Workers' compensation and state unemployment taxes |
$ | 138.0 | $ | 142.0 | $ | 257.4 | $ | 258.6 | |||||||||||||||
| Automatic Data Processing, Inc. and Subsidiaries | |||||||||||||||||
| Other Selected Financial Data, Continued | |||||||||||||||||
| (Dollars in millions, except where otherwise stated) | |||||||||||||||||
| (Unaudited) | |||||||||||||||||
| Client Funds Strategy - Supplemental Information | |||||||||||||||||
| Three Months Ended | |||||||||||||||||
| December 31, | |||||||||||||||||
| 2022 | 2021 | % Change | |||||||||||||||
| Average investment balances at cost (in billions) | |||||||||||||||||
| Funds held for clients | $ | 33.4 | $ | 32.2 | 4 | % | |||||||||||
| Corporate extended (A) | $ | 4.4 | $ | 2.1 | 110 | % | |||||||||||
| Short-term financing to support Client Funds Extended Strategy (A) | $ | 4.4 | $ | 2.1 | 110 | % | |||||||||||
| Average interest rates earned or paid (exclusive of realized gains or losses) | |||||||||||||||||
| Funds held for clients | 2.2 | % | 1.3 | % | |||||||||||||
| Corporate extended (A) | 1.8 | % | 1.4 | % | |||||||||||||
| Short-term financing to support Client Funds Extended Strategy (A) | 3.5 | % | 0.1 | % | |||||||||||||
| Interest income (expense) | |||||||||||||||||
| Funds held for clients | $ | 187.2 | $ | 106.0 | 77 | % | |||||||||||
| Corporate extended (B) | 19.7 | 7.4 | 166 | % | |||||||||||||
| Short-term financing to support Client Funds Extended Strategy (B) | (39.3) | (0.6) | n/m | ||||||||||||||
| Net Impact from Client Funds Extended Strategy | $ | 167.6 | $ | 112.8 | 49 | % | |||||||||||
| Funds Held for Clients - Supplemental Information | |||||||||||
| Three Months Ended | |||||||||||
| December 31, | |||||||||||
| 2022 | 2021 | ||||||||||
| Average balance - Client short | $ | 6.3 | $ | 8.2 | |||||||
| Average balance - Client extended | 15.4 | 13.9 | |||||||||
| Average balance - Client long | 11.7 | 10.1 | |||||||||
| Average balance - Funds held for clients (in billions) | $ | 33.4 | $ | 32.2 | |||||||
| Average interest rate - Client short | 3.6 | % | 0.1 | % | |||||||
| Average interest rate - Client extended | 1.7 | % | 1.4 | % | |||||||
| Average interest rate - Client long | 2.3 | % | 2.2 | % | |||||||
| Average interest rate - Funds held for clients | 2.2 | % | 1.3 | % | |||||||
| Interest Income and Expense - Non-GAAP Reconciliation | |||||||||||
| Three Months Ended | |||||||||||
| December 31, | |||||||||||
| 2022 | 2021 | ||||||||||
| Corporate extended interest income (B) | $ | 19.7 | $ | 7.4 | |||||||
| All other interest income | 9.2 | 1.1 | |||||||||
| Total interest income on corporate funds (component of Other (income)/expense, net) | $ | 28.9 | $ | 8.5 | |||||||
| Short-term financing to support Client Funds Extended Strategy (B) | $ | 39.3 | $ | 0.6 | |||||||
| All other interest expense | 17.7 | 17.8 | |||||||||
| Total interest expense | $ | 57.0 | $ | 18.4 | |||||||
| Automatic Data Processing, Inc. and Subsidiaries | ||||||||||||||||||||||||||||||||||||||||||||||||||
| Consolidated Statement of Adjusted / Non-GAAP Financial Information | ||||||||||||||||||||||||||||||||||||||||||||||||||
| (in millions, except per share amounts) | ||||||||||||||||||||||||||||||||||||||||||||||||||
| (Unaudited) | ||||||||||||||||||||||||||||||||||||||||||||||||||
| In addition to our GAAP results, we use the adjusted results and other non-GAAP metrics set forth in the table below to evaluate our operating performance in the absence of certain items and for planning and forecasting of future periods: | ||||||||||||||||||||||||||||||||||||||||||||||||||
Adjusted Financial Measures |
U.S. GAAP Measures |
|||||||||||||||||||||||||||||||||||||||||||||||||
| Adjusted EBIT | Net earnings | |||||||||||||||||||||||||||||||||||||||||||||||||
| Adjusted provision for income taxes | Provision for income taxes | |||||||||||||||||||||||||||||||||||||||||||||||||
| Adjusted net earnings | Net earnings | |||||||||||||||||||||||||||||||||||||||||||||||||
| Adjusted diluted earnings per share | Diluted earnings per share | |||||||||||||||||||||||||||||||||||||||||||||||||
| Adjusted effective tax rate | Effective tax rate | |||||||||||||||||||||||||||||||||||||||||||||||||
| Organic constant currency | Revenues | |||||||||||||||||||||||||||||||||||||||||||||||||
Corporate extended interest income (see prior page) |
Interest income | |||||||||||||||||||||||||||||||||||||||||||||||||
Short-term financing to Support Client Funds Extended Strategy (see prior page) |
Interest expense | |||||||||||||||||||||||||||||||||||||||||||||||||
| We believe that the exclusion of the identified items below helps us reflect the fundamentals of our underlying business model and analyze results against our expectations and against prior periods, and to plan for future periods by focusing on our underlying operations. We believe that the adjusted results provide relevant and useful information for investors because it allows investors to view performance in a manner similar to the method used by management and improves their ability to understand and assess our operating performance. The nature of these exclusions is for specific items that are not fundamental to our underlying business operations. Since these adjusted financial measures and other non-GAAP metrics are not measures of performance calculated in accordance with U.S. GAAP, they should not be considered in isolation from, as a substitute for, or superior to their corresponding U.S. GAAP measures, and they may not be comparable to similarly titled measures at other companies. | ||||||||||||||||||||||||||||||||||||||||||||||||||
Three Months Ended |
Six Months Ended | |||||||||||||||||||||||||||||||||||||
| December 31, | % Change | December 31, | % Change | |||||||||||||||||||||||||||||||||||
| 2022 | 2021 | As Reported | 2022 | 2021 | As Reported | |||||||||||||||||||||||||||||||||
| Net earnings | $ | 813.1 | $ | 694.4 | 17 | % | $ | 1,592.2 | $ | 1,394.9 | 14 | % | ||||||||||||||||||||||||||
| Adjustments: | ||||||||||||||||||||||||||||||||||||||
| Provision for income taxes | 245.0 | 215.7 | 475.9 | 416.0 | ||||||||||||||||||||||||||||||||||
| All other interest expense (a) | 17.7 | 17.8 | 35.5 | 35.6 | ||||||||||||||||||||||||||||||||||
| All other interest income (a) | (9.2) | (1.1) | (14.8) | (2.4) | ||||||||||||||||||||||||||||||||||
| Transformation initiatives (b) | 2.4 | 3.0 | 1.4 | 0.9 | ||||||||||||||||||||||||||||||||||
| Legal settlements (c) | — | — | (3.8) | — | ||||||||||||||||||||||||||||||||||
| Adjusted EBIT | $ | 1,069.0 | $ | 929.8 | 15 | % | $ | 2,086.4 | $ | 1,845.0 | 13 | % | ||||||||||||||||||||||||||
| Adjusted EBIT Margin | 24.3 | % | 23.1 | % | 24.2 | % | 23.5 | % | ||||||||||||||||||||||||||||||
| Provision for income taxes | $ | 245.0 | $ | 215.7 | 14 | % | $ | 475.9 | $ | 416.0 | 14 | % | ||||||||||||||||||||||||||
| Adjustments: | ||||||||||||||||||||||||||||||||||||||
| Transformation initiatives (d) | 0.6 | 0.7 | 0.4 | 0.1 | ||||||||||||||||||||||||||||||||||
| Legal settlements (d) | — | — | (1.0) | — | ||||||||||||||||||||||||||||||||||
| Adjusted provision for income taxes | $ | 245.6 | $ | 216.4 | 13 | % | $ | 475.3 | $ | 416.1 | 14 | % | ||||||||||||||||||||||||||
| Adjusted effective tax rate (e) | 23.2 | % | 23.7 | % | 23.0 | % | 23.0 | % | ||||||||||||||||||||||||||||||
| Net earnings | $ | 813.1 | $ | 694.4 | 17 | % | $ | 1,592.2 | $ | 1,394.9 | 14 | % | ||||||||||||||||||||||||||
| Adjustments: | ||||||||||||||||||||||||||||||||||||||
| Transformation initiatives (b) | 2.4 | 3.0 | 1.4 | 0.9 | ||||||||||||||||||||||||||||||||||
| Income tax provision/(benefit) for transformation initiatives (d) | (0.6) | (0.7) | (0.4) | (0.1) | ||||||||||||||||||||||||||||||||||
| Legal settlements (c) | — | — | (3.8) | — | ||||||||||||||||||||||||||||||||||
| Income tax provision/(benefit) for legal settlements (d) | — | — | 1.0 | — | ||||||||||||||||||||||||||||||||||
| Adjusted net earnings | $ | 814.9 | $ | 696.7 | 17 | % | $ | 1,590.4 | $ | 1,395.7 | 14 | % | ||||||||||||||||||||||||||
| Diluted EPS | $ | 1.95 | $ | 1.65 | 18 | % | $ | 3.82 | $ | 3.30 | 16 | % | ||||||||||||||||||||||||||
| Adjustments: | ||||||||||||||||||||||||||||||||||||||
| Transformation initiatives (b) (d) | — | 0.01 | — | — | ||||||||||||||||||||||||||||||||||
| Legal settlements (c) (d) | — | — | (0.01) | — | ||||||||||||||||||||||||||||||||||
| Adjusted diluted EPS | $ | 1.96 | $ | 1.65 | 19 | % | $ | 3.82 | $ | 3.30 | 16 | % | ||||||||||||||||||||||||||
| (a) In Adjusted EBIT, we include the interest income earned on investments associated with our client funds extended investment strategy and interest expense on borrowings related to our client funds extended investment strategy as we believe these amounts to be fundamental to the underlying operations of our business model. The adjustments in the table above represent the interest income and interest expense that are not related to our client funds extended investment strategy and are labeled as “All other interest expense” and “All other interest income.” | |||||||||||||||||||||||
| (b)In the three and six months ended December 31, 2022, transformation initiatives include consulting costs relating to our company wide transformation initiatives, partially offset by net reversals relating to severance. Unlike other severance charges which are not included as an adjustment to get to adjusted results, these specific charges relate to actions taken as part of our broad-based, company-wide transformation initiative. | |||||||||||||||||||||||
| (c) Represents an insurance recovery from a legal settlement charge previously recorded. | |||||||||||||||||||||||
| (d) The income tax (benefit)/provision was calculated based on the annualized marginal rate in effect during the quarter of the adjustment. | |||||||||||||||||||||||
(e) The Adjusted effective tax rate is calculated as our Adjusted provision for income taxes divided by the sum of our Adjusted net earnings plus our Adjusted provision for income taxes. |
|||||||||||||||||||||||
| The following table reconciles our reported growth rates to the non-GAAP measure of organic revenue, which excludes the impact of acquisitions, the impact of dispositions, and the impact of foreign currency. The impact of acquisitions and dispositions is calculated by excluding the current year revenues of acquisitions until the one year anniversary of the transaction and by excluding the prior year revenues of divestitures for the one year period preceding the transaction. The impact of foreign currency is determined by calculating the current year result using foreign exchange rates consistent with the prior year. The PEO segment is not impacted by acquisitions, dispositions or foreign currency. | |||||||||||||||||||||||
| Three Months Ended | Six Months Ended | ||||||||||||||||||||||
| December 31, | December 31, | ||||||||||||||||||||||
| Revenue growth consolidated: | 2022 | 2021 | 2022 | 2021 | |||||||||||||||||||
Employer Services |
8 | % | 6 | % | 8 | % | 7 | % | |||||||||||||||
PEO Services |
11 | % | 15 | % | 12 | % | 15 | % | |||||||||||||||
| Consolidated revenue growth as reported | 9 | % | 9 | % | 10 | % | 10 | % | |||||||||||||||
| Adjustments: | |||||||||||||||||||||||
Impact of acquisitions |
— | % | — | % | — | % | — | % | |||||||||||||||
Impact of foreign currency |
1 | % | — | % | 1 | % | — | % | |||||||||||||||
| Consolidated revenue growth, organic constant currency | 10 | % | 9 | % | 11 | % | 10 | % | |||||||||||||||
| Segment: | |||||||||||||||||||||||
| Employer Services revenue growth as reported | 8 | % | 6 | % | 8 | % | 7 | % | |||||||||||||||
| Adjustments: | |||||||||||||||||||||||
Impact of acquisitions |
— | % | — | % | — | % | — | % | |||||||||||||||
Impact of foreign currency |
2 | % | 1 | % | 2 | % | — | % | |||||||||||||||
| Employer Services revenue growth, organic constant currency | 10 | % | 7 | % | 11 | % | 7 | % | |||||||||||||||
| Automatic Data Processing, Inc. and Subsidiaries | |||||||||||||||||
| Fiscal 2022 to Fiscal 2023 Non-GAAP Guidance Reconciliation | |||||||||||||||||
| (in millions, except per share amounts) | |||||||||||||||||
| (Unaudited) | |||||||||||||||||
| Fiscal 2023 | |||||||||||||||||
| Fiscal 2022 | Outlook | ||||||||||||||||
| Earnings before income taxes / margin (GAAP) | $ | 3,804.1 | 23.1 | % | 135 to 160 bps | ||||||||||||
| All other interest expense (a) | 71.3 | 40 bps | - | ||||||||||||||
| All other interest income (a) | (7.1) | - | (10) bps | ||||||||||||||
| Transformation initiatives (b) - FY22 | 3.5 | - | - | ||||||||||||||
| Transformation initiatives - FY23 | - | - | - | ||||||||||||||
| Legal settlements - FY23 | - | - | - | ||||||||||||||
| Adjusted EBIT margin (Non-GAAP) | $ | 3,871.8 | 23.5 | % | 125 to 150 bps | ||||||||||||
| Effective tax rate (GAAP) | 22.5 | % | 23.0 | % | |||||||||||||
| Transformation initiatives (b) - FY22 | - | - | |||||||||||||||
| Transformation initiatives - FY23 | - | - | |||||||||||||||
| Legal settlements - FY23 | - | - | |||||||||||||||
| Adjusted effective tax rate (Non-GAAP) | 22.5 | % | 23.0 | % | |||||||||||||
| Diluted earnings per share (GAAP) | $ | 7.00 | 15% to 17% | ||||||||||||||
| Transformation initiatives (b) - FY22 | 0.01 | - | |||||||||||||||
| Transformation initiatives - FY23 | - | - | |||||||||||||||
| Legal settlements - FY23 | - | - | |||||||||||||||
| Adjusted diluted earnings per share (Non-GAAP) | $ | 7.01 | 15% to 17% | ||||||||||||||
| (a) We include the interest income earned on investments associated with our client funds extended investment strategy and interest expense on borrowings related to our client funds extended investment strategy as we believe these amounts to be fundamental to the underlying operations of our business model. These adjustments in the table above represent the interest income and interest expense that is not related to our client funds extended investment strategy and are labeled as “All other interest expense” and “All other interest income.” | |||||||||||||||||
| (b) In fiscal 2022, transformation initiatives include impairment charges as a result of recognizing certain owned facilities at fair value given intent to sell and accordingly classified as held for sale and lease asset impairment charges, offset by gain on sale of assets and net reversals of charges related to other transformation initiatives, including severance. Unlike other severance charges which are not included as an adjustment to get to adjusted results, these specific charges relate to actions taken as part of our broad-based, company-wide transformation initiative. |
|||||||||||||||||
Subscribe to our newsletter and never miss our latest digital HR news!
By signing up to receive DHRmap newsletter, you agree to our Terms of Use and Privacy Policy. You can unsubscribe anytime.


We have placed cookies on your device to help make this website better. You can adjust your cookie settings, otherwise we'll assume you're okay to continue.

 Back
Back

 X.com
X.com